Highlights from Mission Matterhorn
Revisiting what we achieved
It has been more than four months and we finally decided to write down the experience with Mission Matterhorn which we mentioned in an earlier blog. To recap, we had low-spatial-resolution (>100m) RGB imager which was accessible to via our partner D-Orbit and we had perform a technology demonstration of our pipeline. With this we hoped to show runtime and information compression techniques that we developed. We internally set the following overall mission objectives with our partner’s inputs:
Ability to uplink STORM to a satellite already in space
Autonomous execution on live images as they are acquired
Versatility to leverage VPU to speed up Deep-Learning Models
Real-time vegetation classification
Compression ratio of 5 or more
We had a really big bucket list of applications that we could demonstrate, but we finally settled on the following image pipeline tasks:
Access Satellite Camera
Image an area of 400km x 300km
Check if Camera is looking at target
Correct errors & enhance quality
Detect clouds & mask
Segment unmasked pixels into land/water
Detect vegetation on land area
Categorize vegetated land based on chlorophyll content
Compress results to under 1MB
Transmit data back to Earth
Express schedule
Once our engagement was formalized in the first week of March, we decided to push the pedal on the submitting our onboard app executable in the fastest possible timeline. Given that we had some work done on similar missions before, we were able to share the first version of our app in 10 days. The next steps were tough, particularly for our model where complying to the VPU’s library version was required. We also figured out in the meanwhile how to maximize the outcomes from the onboard run (more about this later). There was a breakthrough in the last week of March when we finally got confirmation that our engineering model runs were successful. We finally got to hear that the satellite uplink was done by April 11th. We had the results downlinked and shared with us by April 18th!
Data exchange
Our data exchange begins with understanding mission and sensor specifications and making the app (particularly models and libraries) compliant to the onboard environment. Finally, the models need to work with onboard imagery, so it is best to get as much onboard sample imagery as possible, or we can always create synthetic imagery.
In this mission, the second step for development of a tested (against onboard sample imagery) application took more than 60% of the overall timeline. I felt this is where a tool like Surge could help to compress timelines while adhering to model guidelines. Fortunately, we got great support during the engineering model (EM) testing and this gave us confidence to give a go ahead for the onboard runs!
Target selection
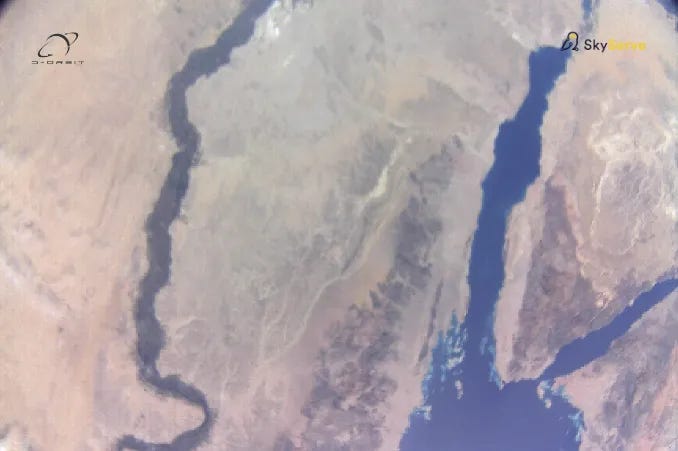
Based on this cool 20-year average cloud cover reference, we figured out the Egypt-Sinai region is expected to be super clear during April and would be an ideal target (compared to other options available) for us. Given the large swath of the imager, the footprint of the Sinai image looked something like this:
Based on the satellite’s orbit TLEs, we were able to guess approximate time of targeting the area of interest. From the geometry of the footprint, we could estimate off-nadir angles at the time of acquisition of the imagery
Image
The image turned out to be great and pretty clear as expected (around 414km swath and 204 m GSD). Notice the camera baffle covering the top corners of the image. Also notice that the Nile river is much thinner than it seems because of dense/dark transition area (riparian basin) between the river and the land.
Interesting bits and learnings
We were able to publish a lot of our data (including performance parameters like runtimes) on the mission marketing page here (kudos to Harmit and Aravinth). This communicated our mission outcomes way better than any presentation or technicality.
Squeezing the maximum from on onboard pipeline with downlink constraints can be done in multiple ways. You can bitpack your inference masks depending on the number of classes. You can get some crops at native resolution, prioritize them by their cloud cover stats, and get histogram stats to recover the original image. You can resample the imagery to get a thumbnail. You can zip all your items together and drop items basis your downlink size budget and priority.
We take the privacy of the models and inference scripts of our customers very seriously. To demonstrate this, we employed techniques of File Encryption and Code obfuscation for software delivery. The specific technique employed for this mission also factored in the software payload size, and time/resource consumption for encryption/decryption.
Contribution to open data
We at SkyServe aim at achieving a user centric approach for mission developments and user interactive products. While we try to achieve this milestone by one stepping stone at a time. One such exercise towards this goal is having our mission data and sample images listed on STAC index using services provided by Ellipsis Drive (checkout our podcast here).
This step allows us to fine tune and refine our data delivery mechanism and quality as per the Open Geospatial Consortium (OGC) standards, while also allowing geospatial developers to access our mission data through APIs to learn the image processing pipeline quality of SkyServe STORM and use the data for their geospatial applications and GeoAI models.
Feel free to try our Matterhorn mission sample data at STAC index here. We will keep adding more products as we go.


