
Internship Update: Detecting Fires Early
Follow the journey of the youngest member of our team as she solves a problem very close to her community


Hi, I am Bhavishyaa Vignesh, a 12-year-old space-tech and AI enthusiast. I love participating in STEM challenges and hackathons. I was the grand prize winner of the Canadian Space Agency's BrainHack challenge. Something I like to do during my holidays is run camps for kids ages 5-13 about Science, Space, and Programming. So far I've taught 500+ students from Canada, USA, South Africa, Nigeria, India, and the UK. I interned with SkyServe for about four months and so much about satellite data, visualization, and remote sensing. I had the opportunity to build a fully-functional fire detection application with the help of my mentor from SkyServe. It was an amazing experience.
Now, for how I got here specifically working with satellite data: In 2020, I took part in ESA's AstroPi challenge, where our team had to identify a problem that could be solved using satellite data. We received satellite images that had our code on them.
We didn’t win the challenge. But that left me in awe for a while, how I could see our planet from space, and how I could so many things with the data. It got me excited because we could use the data for so many things that can help a lot of communities like finding algae in lakes, dangerous temperature levels, vegetation, and much much more.
Ever since, I have thought on how cool remote sensing and satellite imagery really is. It sounded unreal. When I got the opportunity to do an internship at SkyServe, I was nervous, amazed, and just excited that I would get to learn about how to use satellite data.
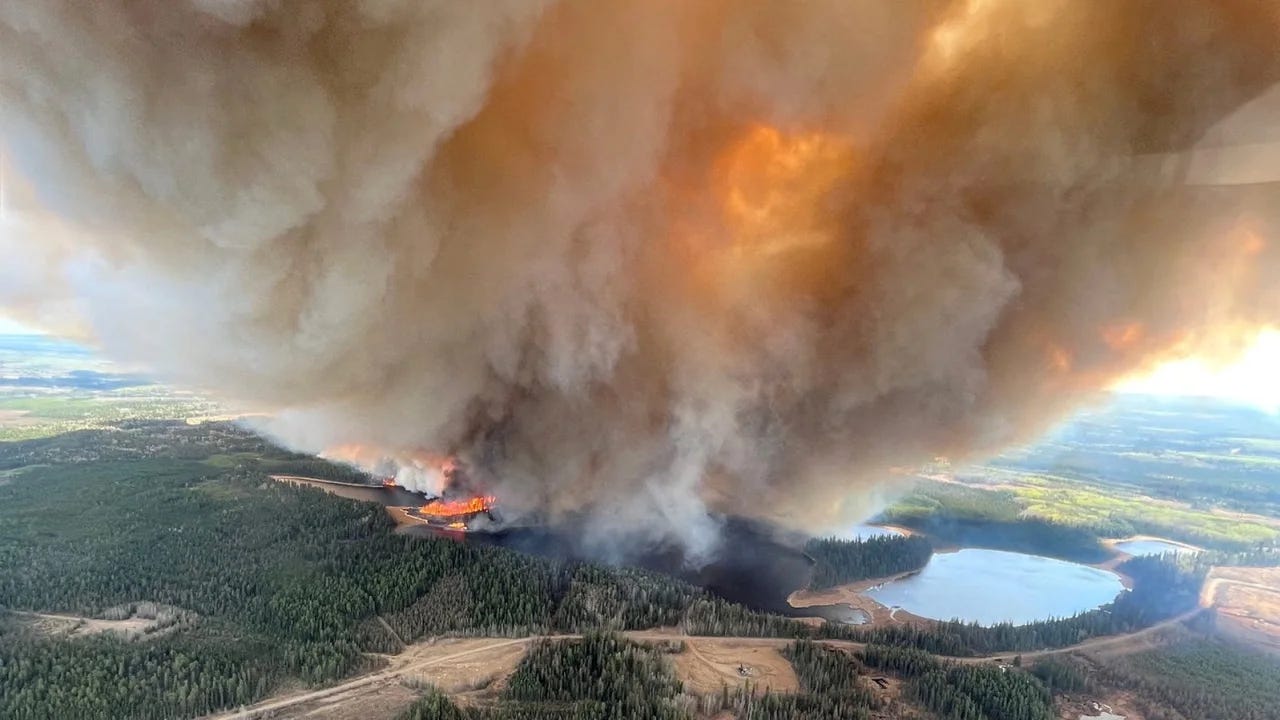
The whole opportunity was awesome. Around the same timeframe that I got a “Yes”, fires began burning in Canada. Especially in British Columbia, Alberta, and the Northwest Territories. A lot of families, communities, and even towns had to evacuate because of that. I live much more to the east, but I could smell smoke and the view was slightly disturbed and slowly began to faint. It was all over popular news channels and websites. Some of them showed satellites picking up smoke in their images. That’s when my idea clicked. This seemed like an exciting idea, to use satellite imagery to find fires.
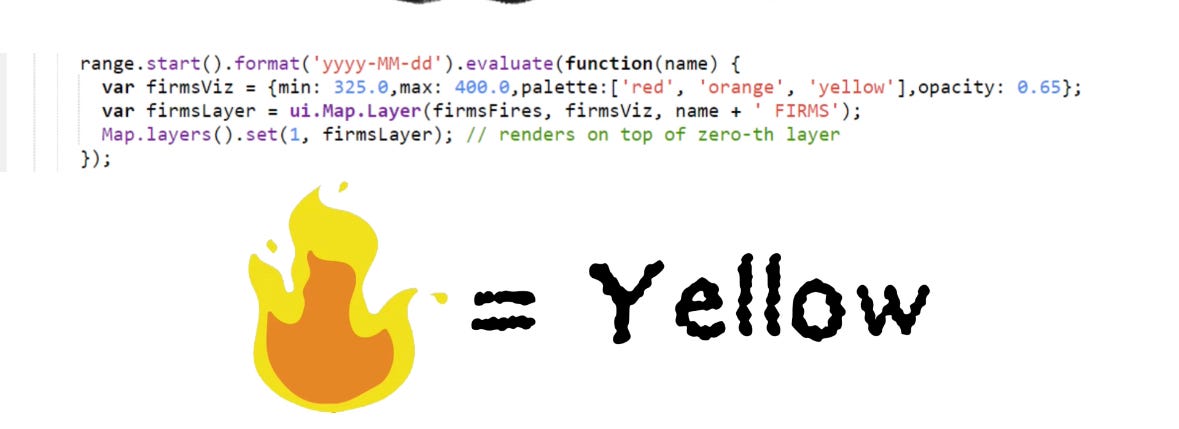
I began with the help of my mentor to learn about all of the layers that can be utilized for this application, the first one that I came across was FIRMS (Fire Information for Resource Management System), FIRMS distributes a near real-time active fire data within three hours of satellite observation. I used a color palette of red, orange, and yellow. Yellow is the biggest fire. It had global coverage, was freely accessible, and had real-time updates. So it was perfect for testing. The first time I saw the mini squares pop up on the map, I was so happy, I had goosebumps and that really wanted me to continue.
I added a lot of layers, with bands mostly focusing on B12, B11, and B9. The different layers would help me understand the different properties, and how to identify a fire. It also helped me understand how to add a layer.
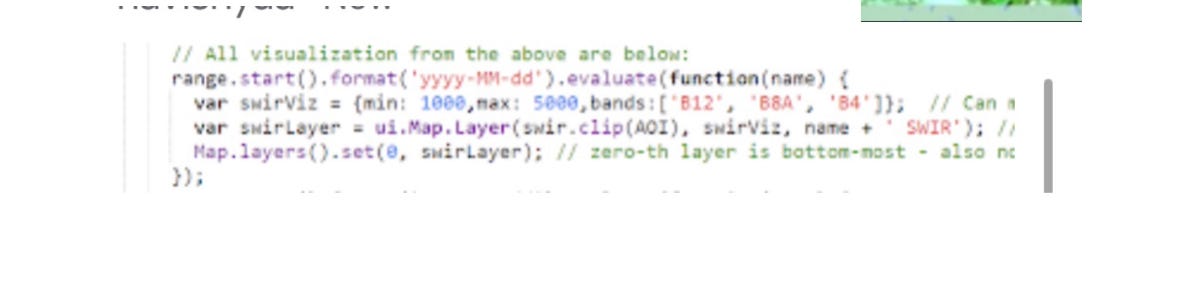
But the three main ones in the program are FIRMS, SWIR composite and a B12-B11 ratio. SWIR standing for short-wave infrared (B12 band of Sentinel-2), can be combined with Near Infrared (B8 band of Sentinel-2) and Red (B4 band of Sentinel-2) to get the`swirLayer` visualization. This layer is what is creating that map-like layer in the background.
The last layer in the code. The calculated ratio is an indicator for potential fire areas. This calculated ratio (`b12b11`) is used as an indicator of potential fire activity. Seeing the distribution of values of this ratio, we selected a trheshold value of 1.5 to detected areas where the SWIR-2 to SWIR-1 ratio is a potential active fire burning when the satellite flew overhead.
But it didn’t work perfectly on the first try. I encountered a few major errors:
I saw that there was a fire in a community, on top of a house, so I assumed it was a house fire but it was showing orange and when I zoomed into it, it was showing a rooftop. I searched for fires around the neighborhood in local news, but none were correlated. It showed a gleaming solar panel as fire. That could have multiple reasons for failure. I also had some false detection of fire from the sun glinting from water bodies. So, to confirm if those fires were real, I would check on multiple layers, and my fire detection layer picks up the fires that seem the largest, and will be picked up by almost all of the layers. But FIRMS covers globally and can pick up fires that aren’t picked up by others. For the sun glint problem, using a water mask can mask out the water bodies that were in the Area of Interest!
I truly learned a lot in the process, and I am very thankful to SkyServe for giving me the opportunity. I never knew how much can be achieved with satellite data, especially in solving problems like this. With all this new knowledge, I can’t wait to continue on this satellite imagery/remote sensing journey.
Watch my interview - “From Pixels to Patterns” - with my mentor Adithya from September.
From the Mentor
Adithya Kothandhapani: It was a fun experience working with Bhavishyaa on her project. It is amazing what one can do with satellite data given the tool, imagination and most importantly an infectious passion!
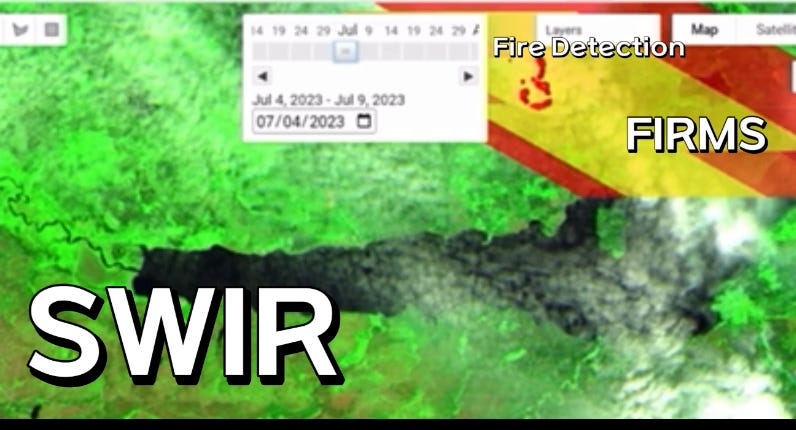
Over the last few days, we have seen another series of events unfold in Punjab where crop stubble is being burnt due post-harvest. I put together a GIF to show how Bhavishyaa’s App helps enable pin-pointing of active fires. The last (mostly green) image is from the high-resolution Google Maps Satellite view - which could in theory be used to even report the address of a farm on fire. If we include a ‘Burn Scar’ detector alongside this visualization, it shows where recently doused fires have left a visible mark on the land. Notice (a) the wispy smoke columns emanating from the active fires detected in yellow, and (b) that some active fires overlap the burn scars :(

The plot above condenses insights from the same area shown in the animation. Intent is to leave you the reader with something to think about. Clue: kharif crops are sown in June & harvested in October (DOY~300); rabi crops are sown in November & harvested in May (DOY~120).
 | A guest post by
|